
Simple Distortion Measurements
Do simple distortion measurements make any sense? Even if taken from loudspeaker output?
With simple, non-laboratory grade test instruments and environment: can we read anything interesting out of distortion measurements?
I made some, using REW on a notebook and a USB microphone. Loudspeakers are good Hifi quality 3-way floorstanders, measured in a living room (no acoustical treatment) at listening position.
Abbreviations
SPL = sound pressure level. HD = harmonic distortion. R = right loudspeaker. L = left speaker. MF = mid frequency. LF = low frequency. JOB = JOB 200 power amplifier, swiss discrete AB design. TDA = cheap DIY chipamp. 509 = DIY single ended tube amplifier using PL509 in triode mode.
1 – comparing L and R speaker output
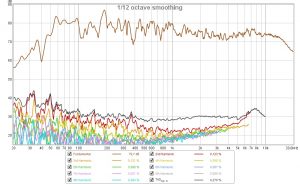
Using JOB. Left please see top picture. Right below.
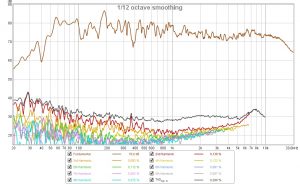
R_Job_m35dB
Below 200 Hz, stronger L SPL response ripples produce stronger HD response ripples. Why? One example: Imagine a room reflexion canceling the fundamental but not a HD component. Hence this particular HD component will be magnified by room influence.
2 – Level influence
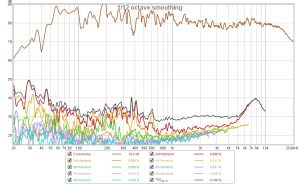
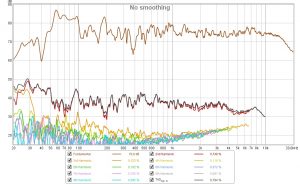
R_Job_m30dB
Again using JOB, 5 dB higher level. The power amp is working far from saturation, we may expect very little level influence on HD. But the speaker’s HD is clearly higher at the 5 dB higher signal level. Mostly at the MF (200-400 Hz) and LF speakers low end, where excursion is high.
3 – Quite different SPL vs frequency with 509 (SE tube amp) vs solid state!
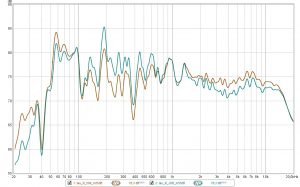
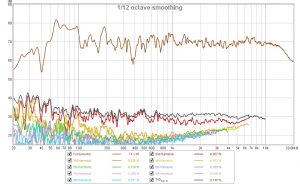
R_SPL_509_vs_JOB
The SE tube amp’s output operates without feedback. Therefore the output impedance is high. This modulates the output voltage, depending on the speakers frequency variance of impedance:
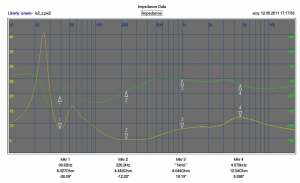
loudspeaker_impedance
We could even estimate the amplifier output impedance combining information from those plots.
4 – amplifier distortion
R_TDA_m35dB
The distortion with TDA looks quite similar to JOB (both solid state with lots of feedback) .
But the SE tube amp clearly produces lots of second order distortion :
R_509_m35dB
5 – level influence, tube amplifier
Due to the input circuit the 509 amplifier is allready slightly overdriven at the chosen standard test level. At 5 dB lower level, the dominant second order distortion is significantly diminished :
R_509_m40dB
6 – Looking closer
we can see a power supply ripple problem of the TDA amplifier (see above, 4 – amplfier distortion). Rising second order distortion at 50 Hz compared to JOB. HD2 @ 50 Hz = 100 Hz, the supply capacitor’s loading current frequency.
Final comments
Readout of distortion components in the tables below the curves is at 1 kHz. It is easier to identify a percentage this way than subtracting “fundamental” and a “harmonic” component curve values. As an example, minus 40 dB corresponds to 1 percent distortion.
Measurements were taken with simple equipment: Notebook headphone output into power amps, cheap USB mic input into REW on same notebook. (Please note that some HF distortion is induced by HF aliasing IMD in my measurements. Sorry.) We may expect similar results using our smartphone’s headphone output and built-in microphone. And even better ones, if measured closer to the speaker with less room influence and maybe a bit of clever averaging. As used within the TestHiFi app.