
Complex bass array – Plattenwerk.at
In my last TestHiFi blog I wrote about a band-limited low frequency (LF) system to fill a response gap. This time I would like to show a much more complex LF system.
Some years ago I was asked to visit Plattenwerk.at. They spoke about low frequency (LF) issues …
The problem
See the initial situation below:
Simulation confirmed measured LF response abberations of the KH monitors at work, due to strong room interference.
They liked the look of their room too much to destroy it with large LF treatment, asking if something else could be done?
A 3-D solution
Main interference was caused by strong frontwall reflexions, enhanced by sidewall influence. Therefore I designed a 3-dimensional woofer array built into a new frontwall. With enough volume behind to contain all 16 8-inch woofers within 16 separate closed cabinets.
The toe-in of left and right main panels is adjusted to allow phase-correct summation at the listening area. This geometry also helps to focus the sound away from the sidewalls.
HF would be radiated by a 1-inch horn, to keep up dynamically with the large array. 2 woofers above and below the HF horn run up towards the HF crossover point. The rest of the array is „tapered“ with LF shelves, to prevent midrange interference and imaging problems.
A complex design task
The „tapering“ of the individual woofer responses helps to radiate constant energy with linear on-axis response. Imagine a source where only the central HF horn radiates HF energy, the two woofers above and below (filtering assisted by stronger magnets than the others) dominate the midrange radiation, and the lowest frequencies are covered by all woofers. That way, the size of the source shrinks with rising frequency, just like the wavelength.
Different woofer locations cause different time delay towards the listening position. Different filters for every woofer were optimized to compensate the resulting phase issues and provide total linear energy- and on-axis response.
All filtering is analog – with least parts count. The bass-array is driven by two differently filtered amplifiers.
And of course I wanted the result to provide perfect step response, plus summation without phase issues.
Array Design
I had no software on hand to simulate all 9 drivers including their geometry at once. Designed a small spreadsheat to calculate individual geometric delays for each woofer.
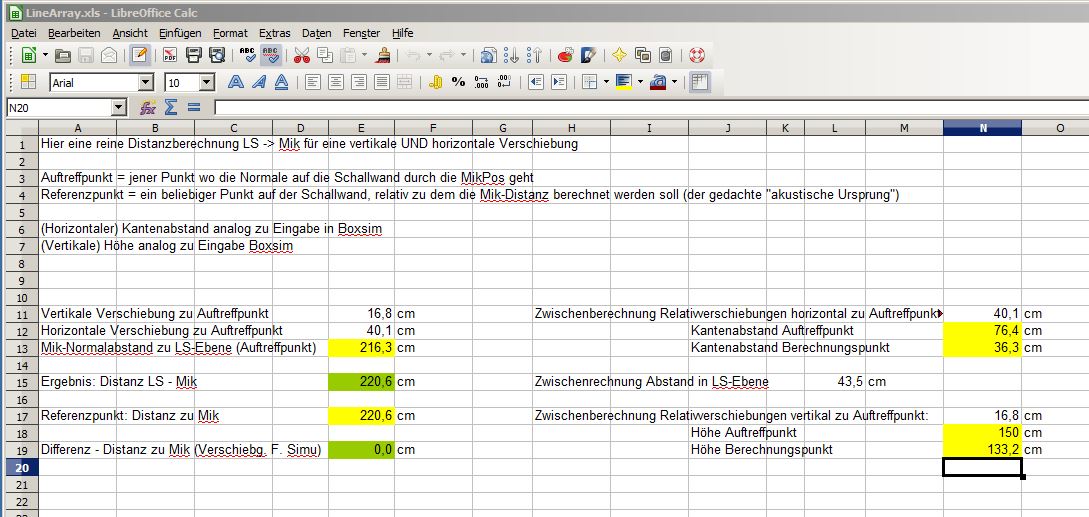
Imported into Boxsim (free!) the iterative optimisation of filters and geometry for the LF system could be handled. This also allowed a rough estimation of radiation characteristics.
The result
Some 100 iterations later … measured at the listening position
Doesn’t it look nice? And yes, down to 20 Hz. A few narrow notches is what’s left of the room influence. Remember, no LF treatment anywhere! Nihil compared to the start situation 🙂
Now for the time domain
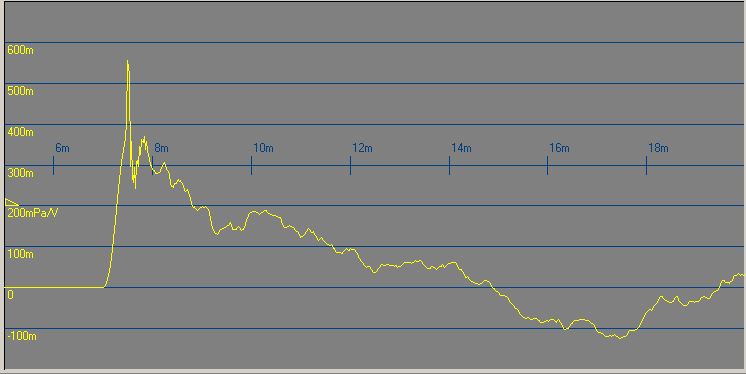
Aside from the ringing cycle of the HF system (following the initial peak) a very nice step response. No strong LF ringing shortly after the initial peak, thanks to closed box design.
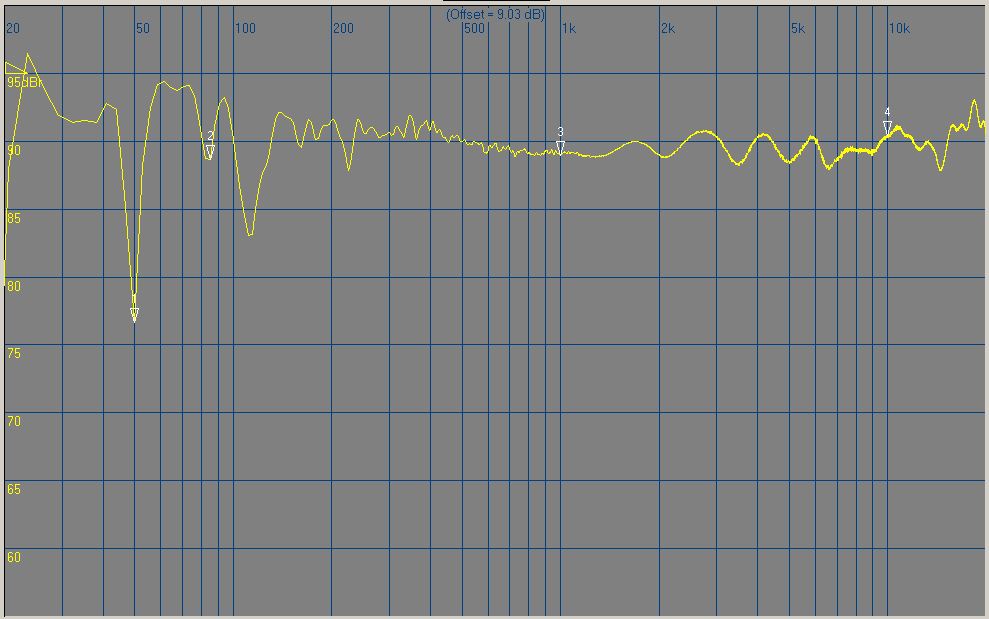
To check for midrange phase issues of the large array, let us for example move 70 cm forward from the main listening position and zoom into the measurement (200 – 10 kHz now with 2 dB / div resolution)
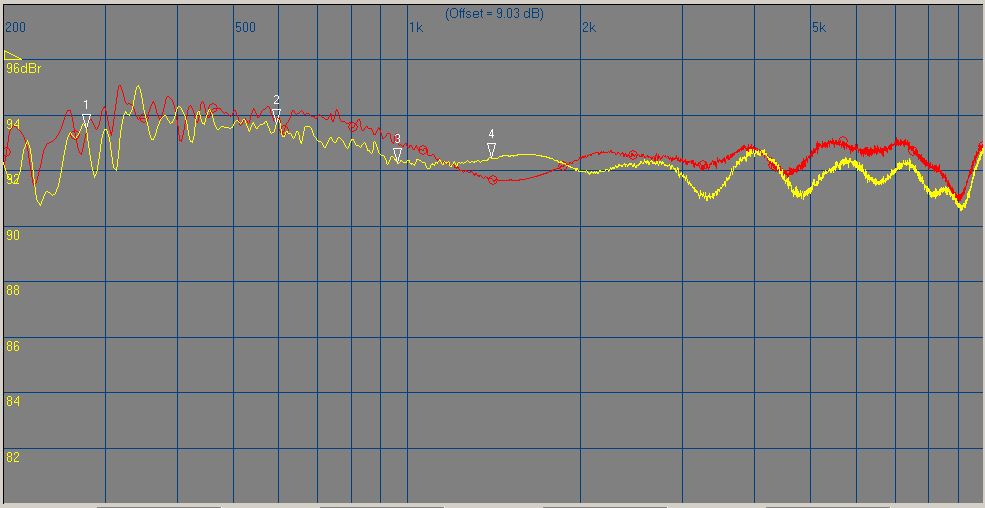
Most probably these changes are due to different meter bridge interference, and remain within a narrow +- 1 dB band. Still very nice.
Nearfield loudspeaker influence
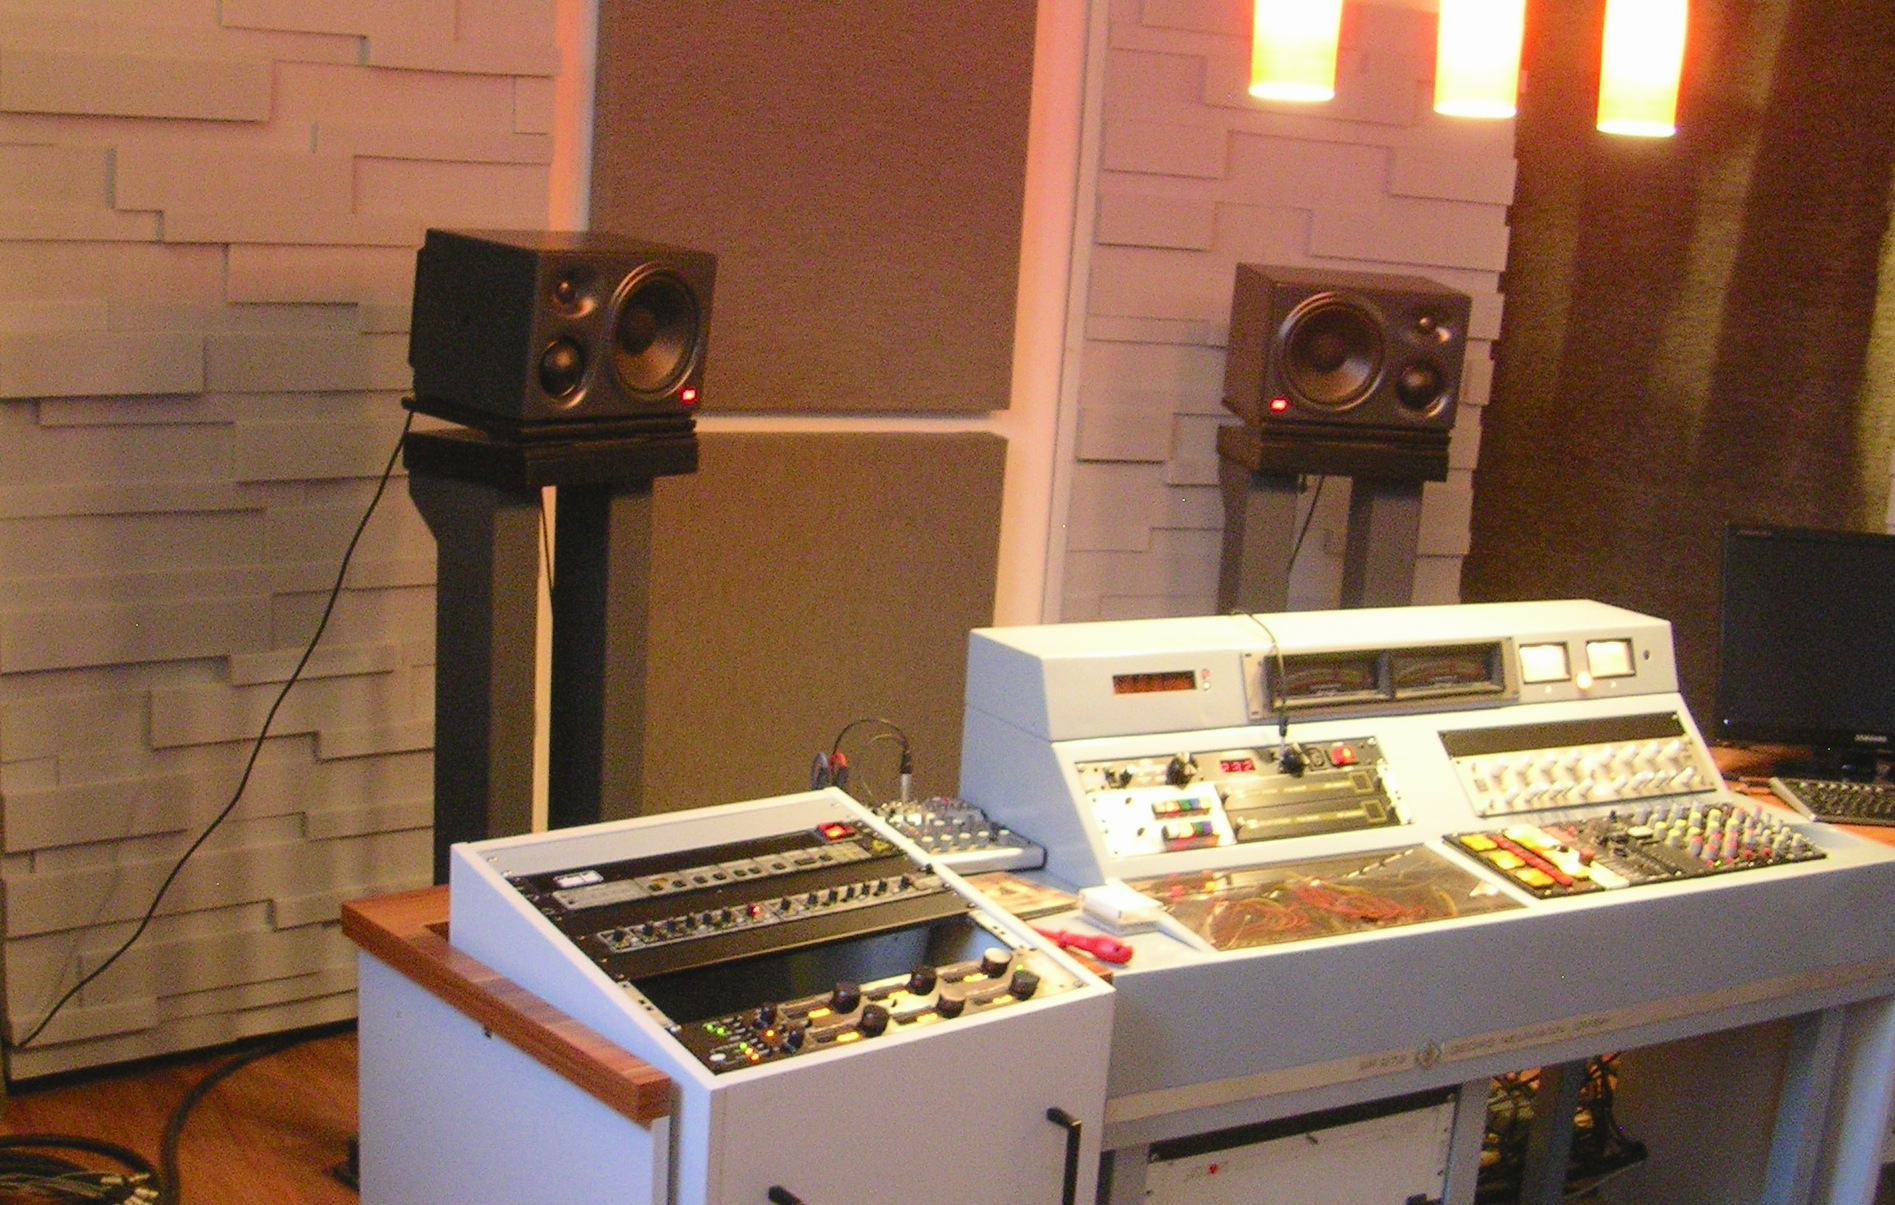
Looking at the title picture you can see some loudspeakers on top of the meter bridge. Their influence on the direct sound of the array was measured. Let us zoom in and see what they do:
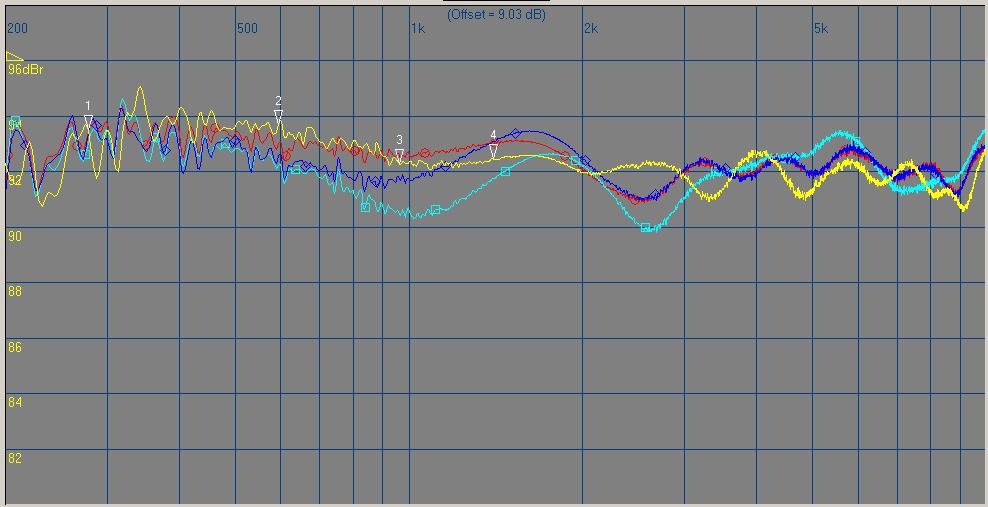
red trace = 20 cm down from standard listening position
cyan = NS10 horizontal mount
blue = NS10 vertical mount
It is easy to see that the NS10 interfere less if used in upright position. Still, for critical listening, they need to go.
Tighten your screws !
The cabinet production was a DIY project of the studio owners. At a later visit, the now painted cabinets looked quite a bit better. But what had happened to the sound? They were clearly lacking some bass definition!
Turned out they had forgotten to tighten about 30% of the screws holding the woofers. Fixing that, bass was also tight again. To an astonishing degree.
addendum
Since we received questions – sorry I didn’t cover all aspects, as I was told that Blogs need to be short.
The low end sounded so much better than before, that I made no extra measurements. Work on location focused on response at listening position. Therefore, no decay measurements done. To answer a reader’s question, I now tried to extract such from short 500 ms time data.
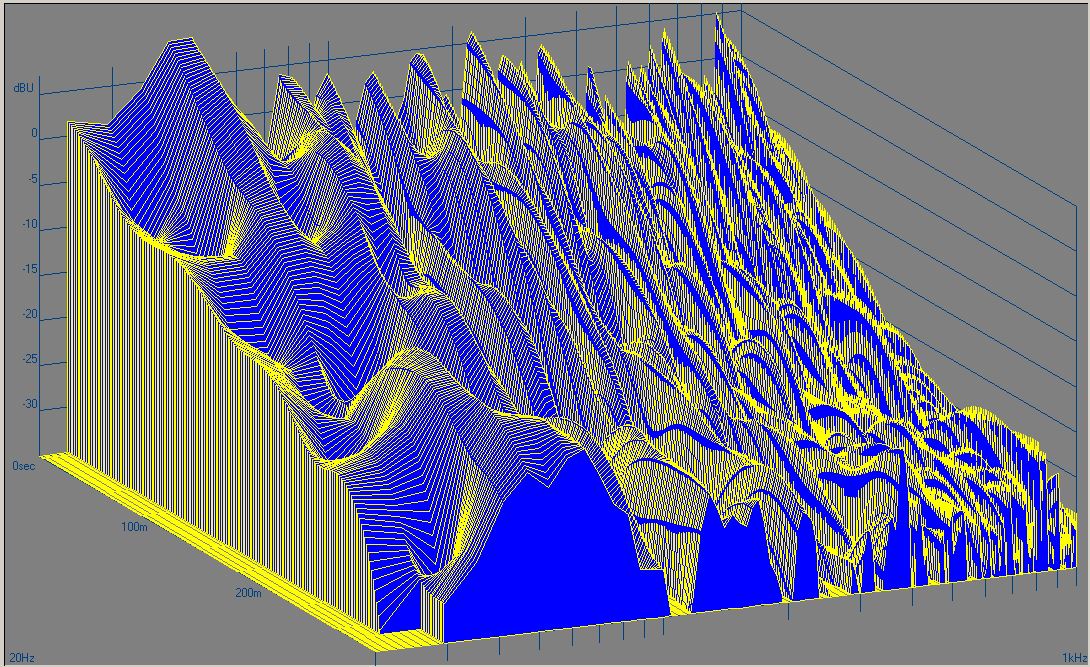
Frequency spans from 25 – 1k Hz, time to 300 ms. Resolution too limited for good results, sorry. That would need a much longer sweep and timefile.
I did some FE modeling before the speaker design. There were strong floor to ceiling (49 Hz) and side to side (58 Hz) modes. These are covered by the woofer distribution of the large array (well, mostly).
To prevent strong length mode excitation, the loudspeaker panels do not completely seal the gap to sidewalls and ceiling. I used FEM again to determine gap width and length as follows:
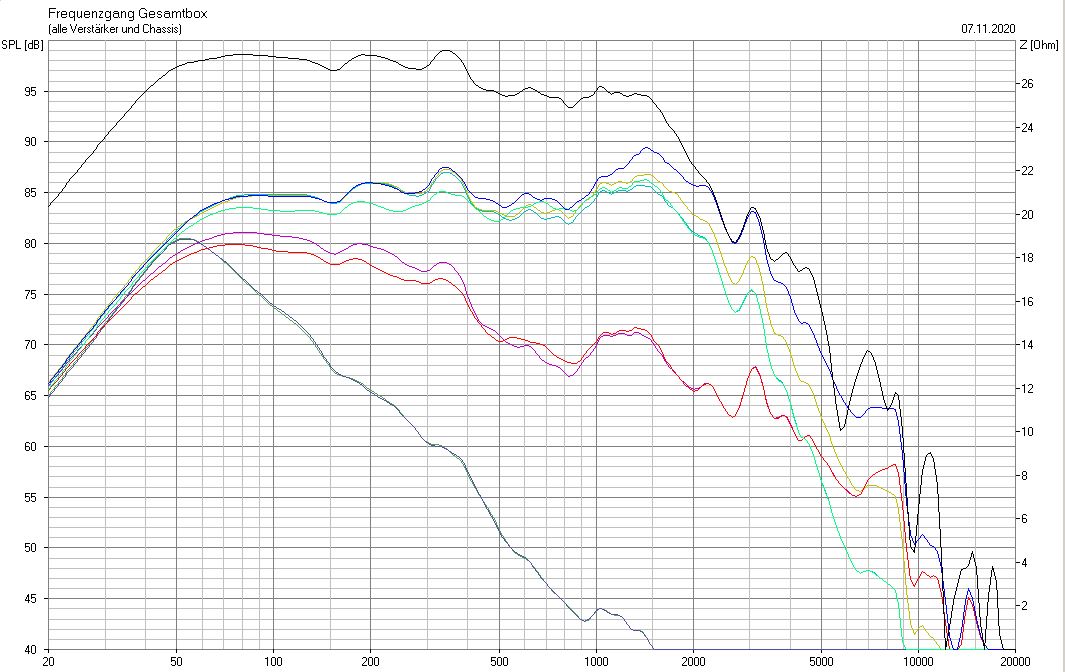
Take a look at the Boxsim array simulation: the basic response of the 8 inch woofers in their 80 liter closed cabinets ends below 50 Hz.
To extend the LF response, carefully calculated room assistance is used.
A 36 Hz length mode helps to extend down to 33 Hz. Below, the room gain is raising and further extends the response towards 22 Hz.
The 36 Hz length mode damping was adjusted by the side- and top gap width towards a flat total response around the listening area. It all worked out nicely.