")
Frequency Response (Amplitude versa Frequency)
Between reasonably designed music systems (and setups), the frequency response is the most important characteristicum.
The new version of TestHiFi now includes the (paid) option to display a frequency response.
Measuring amplitude versa frequency shows if our system reproduces all frequencies at the same level. A necessity for neutral sound – is it? Exactly how flat should the response be?
Let us have a look at some practical applications.
Loudspeaker development
When working on a loudspeaker, I often take hundreds of frequency response measurements.
Measuring individual driver responses (amplitude and phase / time), to generate a computer model.
Using the model, I develop or improve the crossover network. Build a physical prototype, measure and compare the response to the model.
The validated model is then used to further improve the loudspeaker, with ongoing measurements and listening tests.
Once all phase issues are worked out, the loudspeaker receives more listening attention than measuring.
Why do I need extended listening tests after all these measurements?
Loudspeakers have other issues besides linear response. I already mentioned inter-driver phase and distortion. The directivity will change with frequency. The dynamic behavior and resolution will vary with frequency (due to frequency dependent loss and resonances).
All this leads to different sounding speakers, even if they have the same on-axis response.
Therefore, for all speakers to sound as neutral as possible, they will have different frequency responses. Deviating from a flat line.
With a direct radiator (diaphragms like cones and domes of regular loudspeakers) fine-tuning the response in 0.5 dB increments will do.
Horn loudspeakers usually are more critical, demanding 0.1 dB steps. And sometimes even finer adjustments. Our ear can hear 5/100 dB increments from a good horn loudspeaker system. This is far smaller than line thickness in my plots! To discriminate changes like that, I use the computer model. Measurements wouldn’t reproduce them accurately.
This doesn’t mean the final on-axis response will be flat within 0.1 dB – see above. And below.
Room acoustics and loudspeaker setup
Even a perfect loudspeaker driven by wonderful gear will often sound far from perfect in a real room.
Room reflexions will interfere direct sound and modulate the frequency response. Every single reflexion introduces comb filtering. I posted several blogs about this.
First try to achieve good 40 – 400 Hz response (as flat as possible). If found and acceptable, small movements may help to further optimize midrange and high frequencies. Remaining problems above 400 Hz can usually be treated by moving some room decor or acoustical treatment.
In a studio’s control room, of course there will be low frequency treatment as well. Usually large and expensive. But … the less, the better. It all starts with a good basic geometric setup.
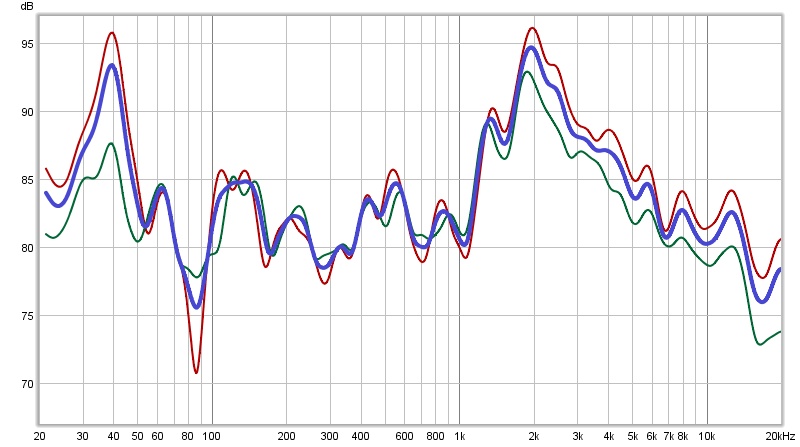
As an example one of my older Betahorns, measured in various positions of the owners new home. Compared to a setup in my living room (green line). During our first session, we tried a few positions that seemed acoustically ok and convenient to live with. The first 3 show strong low frequency loss. Some heavy midrange interference from narrow, untreated parallel walls at left and right side.
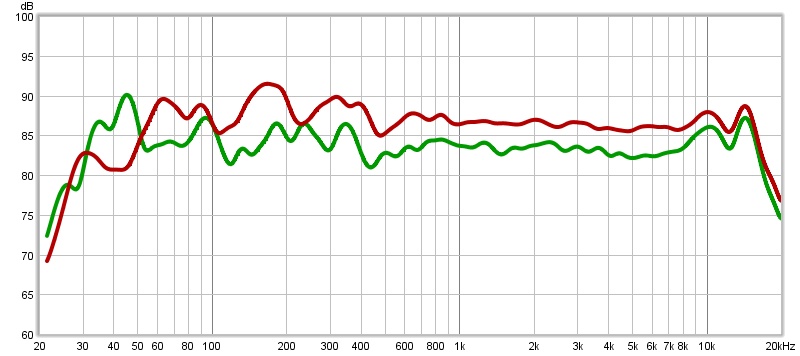
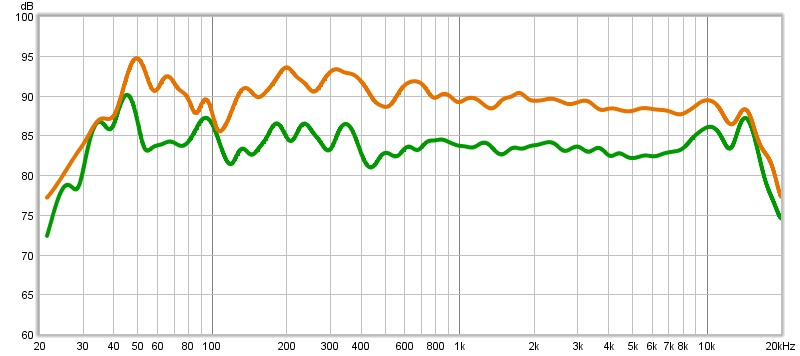
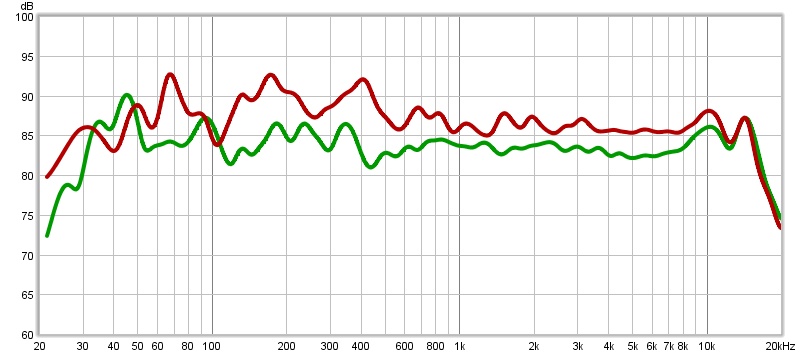
These plots correlate very well with our listening impressions.
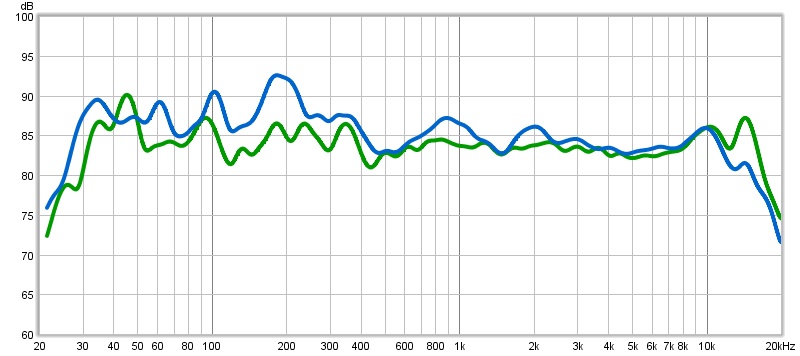
The Betahorns finally went closer to one room wall to prevent low end exstinction by late front wall reflexions, similar to the fourth measurement.
Listening position measurements
While this includes a lot of room reflexions, I like to measure at the listening position. Not only for initial speaker setup. But also for crossover development (once a reliable computer model is achieved).
Firstly because this is what I hear, sitting there. Which assists listening sessions. And, the speaker has to work with, not against the room.
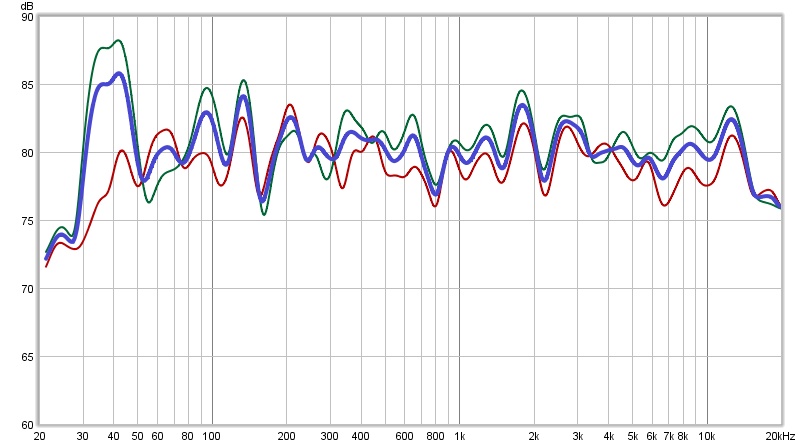
See measurements of a system I worked on recently, based on a Great Plains Audio 604 coaxial driver. See the heading picture.
I received it with the request for better crossovers and maybe some cabinet tuning.
Both the problematic initial crossover and the unfortunate room setup are mirrored in the response. The huge 40 Hz bump is caused by a mistuned large Onken-style reflex cabinet AND setup. Speaker close to front wall, listener close to rear wall. Strong room mode excitation at the same frequency as the mistuned cabinet. A 15 dB peak around 2 kHz reflects the “metallic” sound of the initial crossover.
2 weeks later the huge speakers behave civilized. Still, I kept a slight emphasis around 1.8 kHz. Here, the large woofer still contributes to the total energy, but with strong forward directivity. Hifi setups often contain about 50% or more diffuse room energy at the listening position. With a linear response through the presence region (1-3 kHz), the speaker would sound too laid back.
Measurement procedure
It works well to measure the right speaker with the microphone in the right ear position. Same with left speaker at left ear position. Finally take an average of both, smoothed 1/6 octave. The resulting response will match well to the perceived timbre of the system.
TestHiFi now includes the option to measure in a similar way, to help with speaker position and room acoustic variations.
Final word
There is a limit to what frequency response measurements can tell us about sound quality.
Today, the frequency response is often manipulated with digital filters. Some gear allows the user to perform equalization. But don’t forget, if applied to a finished multiway loudspeaker, this does not change inter-driver problems. Nor does a linear equalizer significantly reduce distortion from undersized speakers. But listening position measurements definitely help with room setup and equalization.
Best Regards,
David Haigner