
Position is key
Influences to the frequency response
Sure, we all know about and talk about the frequency response. Measuring amplitude over frequency. Of course, this is far too profane for a proper audiophile to have a seriously debate about it. Except using it as a superlative sometimes.
It goes like: I changed “that special thing” and could eliminate the dip of 0.5dB at 250Hz… We know all such “professional” tech talk.
The other exaggerated thing about the frequency range is how it is used by retailers as a kind of a basic quality indicator for audio systems. “This system goes as deep as 20Hz…”. Not even mentioning the amplitude level at those frequencies.
The frequency response has been used for decades and still it makes me wonder how much effort some put into extreme fine tuning the frequency response of their audio system. While at the same time they put rather low attention to the room acoustics and the position of the system within the room.
This blog will talk about the 5dB, 15dB or even bigger upper and lower declines, dips or peaks in the frequency range which can be almost switched on and off just by the position respectively by reposition of the audio system. However, we will look only at one simple example, just for the sake of very brief and easy explanatory.
Modern world does not prevent for classic physics
No worries, as mentioned before it will not be about formulas and difficult measurements, however also in audio we cannot circumvent or trick basic physic rules. Sound and as such also music are frequency waves. In case the same frequency arrives at our ear twice, with one being slightly (half a wave length) later, the two frequency waves will delete each other. More about this can be found in our various other blogs in far more detail as well as far more technical explanations.
The room influences the sound
Room acoustics influence the sound we hear from an audio system. Walls, sealing, floor or objects reflect, diffuse or damp the sound. In simple terms, a speaker directs a lower frequency wave not only to the front, but the lower frequency wave will also go to the back, actually to all directions.
If there is a massive wall in short distance behind the speaker it will reflect the lower frequency wave back towards the front. Now the same frequency will arrive directly at our ears from the speaker and a little bit later again as a reflection from the wall. In case this little time difference equals exactly the time of half of the wave length, we hear the frequency with a lower amplitude as if it would be without the reflection. Diffusion, damping or a combination could help to prevent for such reflection. That was described in David’s last blog.
The right balance?
Many people I talk to, even though they spent easily the equivalent of a decent new car on their audio equipment, treat such room acoustic influences as rather less important. I am often surprised that listening to a high-end system is so important to them that they spend a huge part of their life time to it, but are not willing to move the speakers in different positions to optimize the sound. The visual appearance of the room seems to be more important as the sound quality. But actually, it is not, not for them either. It is kind of an ignorance to the significance of room acoustic effects on the sound we actually hear at our listening position.
As mentioned before, nuances like 0.5dB adjustment in frequency response of the audio system is easily worth some huge amounts, although the system is then placed into the room according to visual reasons.
Most audio systems in our modern world are small, wireless and smart
Since several years the sales statistics show, absolutely most systems sold are small, often of a size that can easily be carried around. At least, since they are mostly wireless, it is easy possible to reposition.
With modern technology and technical design many of those small systems have a surprisingly acceptable flat frequency response.
Since we easily move them around, the positions they take are quite important to the sound they deliver. But especially regarding those smaller speakers we kind of accept the fact that they might deliver less quality sound. We usually undervalue that the surroundings to such a small speaker is often more important than the flatness of the frequency response the speaker itself delivers. And this effect, the low or wrong knowledge, seems to grow significantly and fast, somehow correlating to the growth of the market of the so-called smart speaker.
However, it should be possible to close this knowledge gap and we, TestHiFi work on that.
First positioning of a mobile speaker
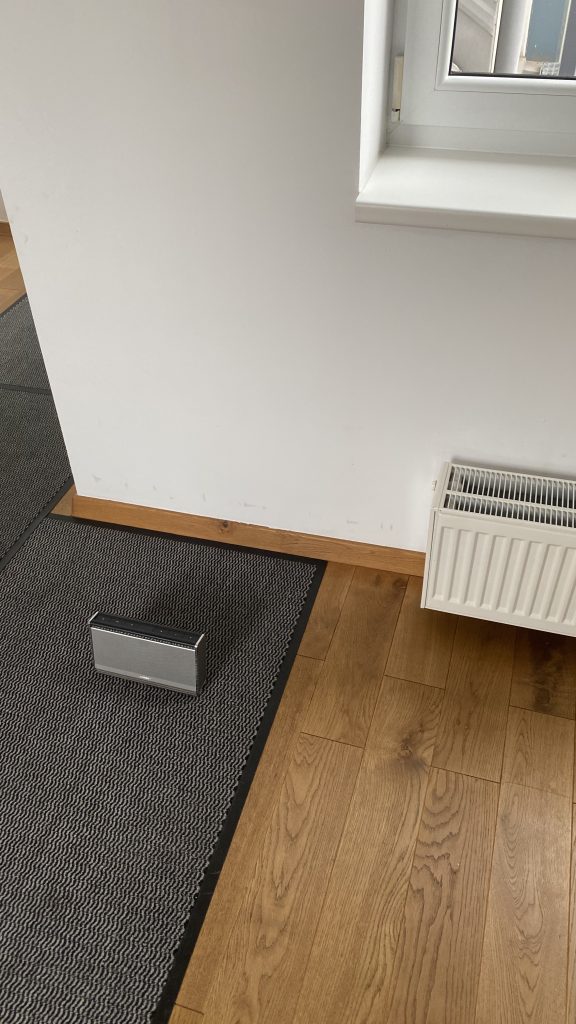
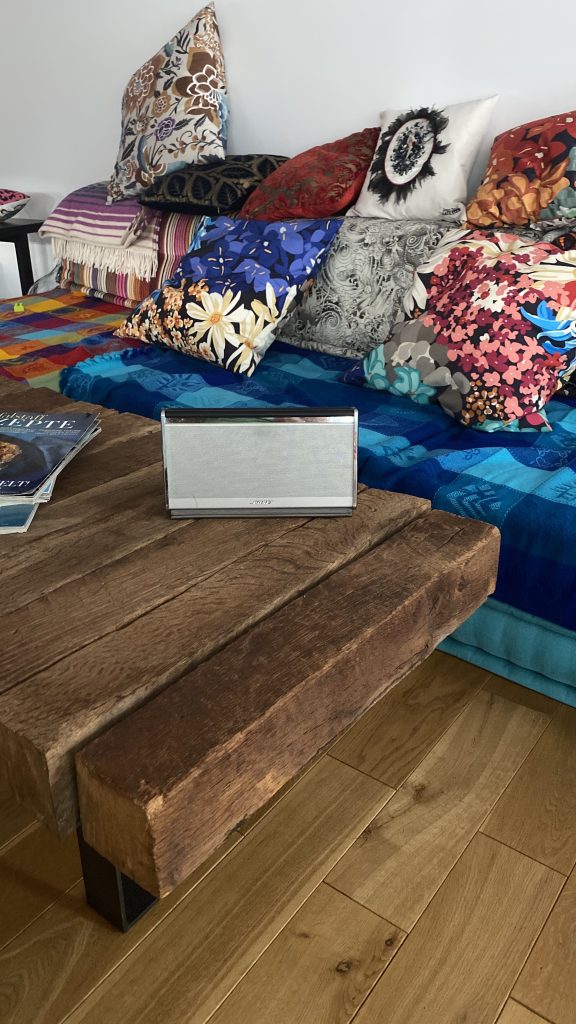
The first position shows a small Bluetooth speaker positioned on the ground, close to a wall. This situation is not as unusual as it might look on the picture. Let’s think about a group of young people sitting together on the ground. They listen to background music while the speaker is put next to the wall in a more protective position. Just better as if it would be placed in the middle of the room, where someone might step on it.
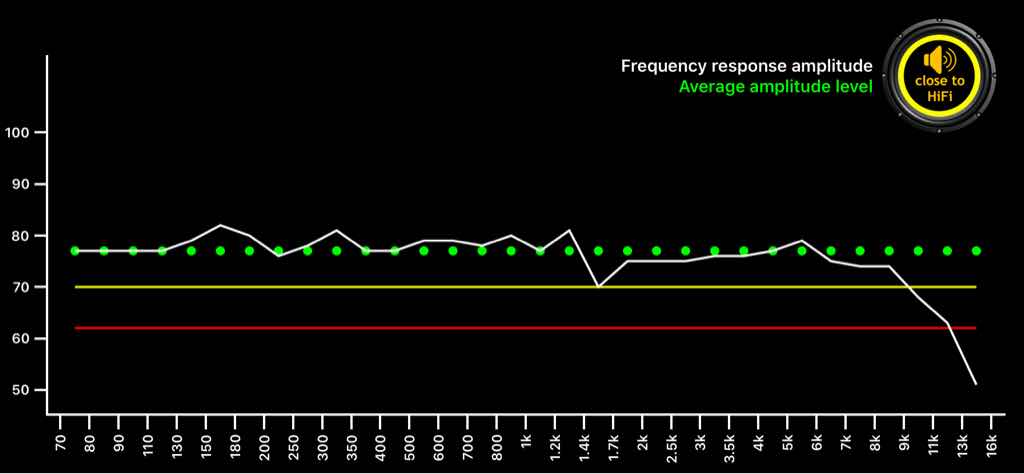
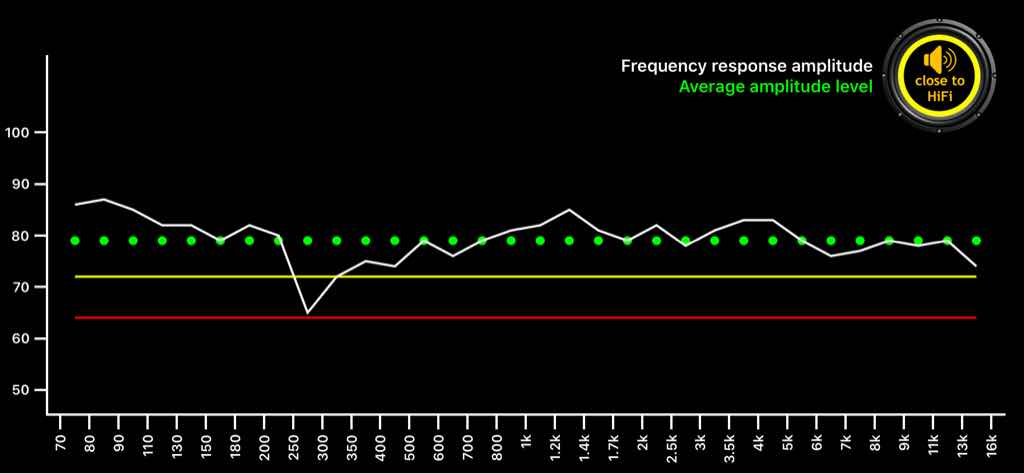
The following pictures show a frequency response measurement taken with the soon coming new version of TestHiFi that will include a graphical output as an option. We see, although the speaker is close to the wall there is no reflection of lower frequencies harming the frequency response. We will see in the following measurements, there is quite a decline to the lower end of the frequency range, as under other conditions the lower frequencies are rather higher in amplitude.
However, the significant effect in this position is the decline to the upper end of the frequency range. Without having it analyzed in detail, it would be a good guess, that the carpet and the slightly higher measurement position might be the reason for the significant decline.
However, the significant effect in this position is the decline to the upper end of the frequency range. Without having it analyzed in detail, it would be a good guess, that the carpet and the slightly higher measurement position might be the reason for the significant decline.
TestHiFi’s overall audio device examination result:Close to HiFi
Frequency response amplitude drops result:Close to HiFi
| 1: | 13000-16000Hz | -26dB |
| 2: | 9000-13000Hz | -13dB |
| 3: | 0-0Hz | 0dB |
| 4: | 0-0Hz | 0dB |
| 5: | 0-0Hz | 0dB |
| (see attached graph no.1) |
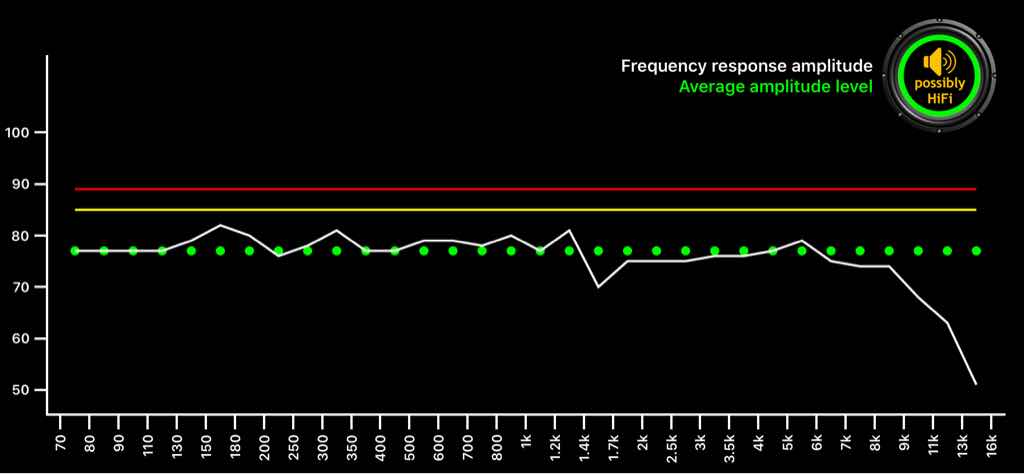
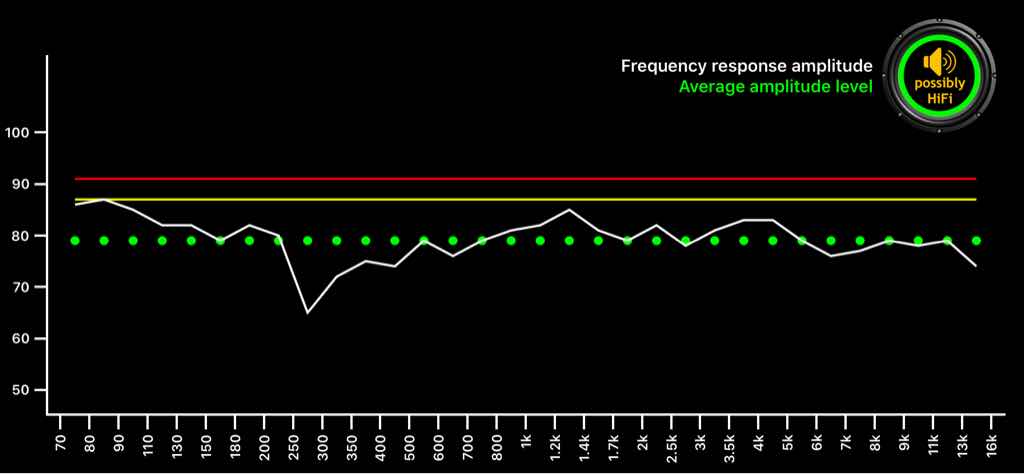
Frequency response amplitude peaks result:Possibly HiFi
| 1: | 0-0Hz | 0dB |
| 2: | 0-0Hz | 0dB |
| 3: | 0-0Hz | 0dB |
| 4: | 0-0Hz | 0dB |
| 5: | 0-0Hz | 0dB |
| (see attached graph no.2) |
Loudness at harmonic distortion limit result:Possibly HiFi
| 1: | 65-75Hz | 0% |
| 2: | 75-95Hz | 0% |
| 3: | 95-150Hz | 5% |
| 4: | 150-200Hz | 0% |
| 5: | 200-250Hz | 0% |
Intermodulation distortion – low freq. retult:Possibly HiFi
| test tones between: | 70 – 240Hz |
| Distortion level at: | -90% |
Intermodulation distortion – high freq. result:Close to HiFi
| test tones between: | 620 – 13kHz |
| Distortion level at: | -50% |
Aurally-weighted intermodulation disconsonance result:Possibly HiFi
harmonic distortions K4 – K9 with higher levels identified compared to lower harmonic distortions (K2&K3)
| level K4+ above K2: | 0 times |
| level K4+ above K3: | 0 times |
| level K4+ above K2&3: | 0 times |
| max. level difference: | 0 % |
Stereo capability result:Close to HiFi
only one stereo channel or only one single box or two separated stereo channels found
| channels identified: | one |
| channel deletion: | no |
| stereo separation: | no |
Second positioning of the mobile speaker
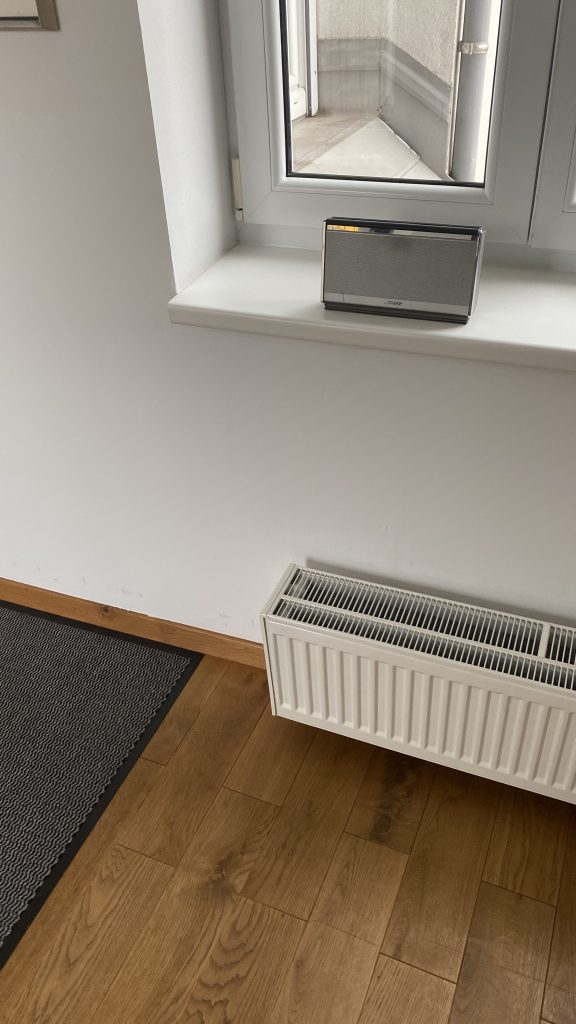
The second position shows the speaker in a corner of a window. It could also be a shelf or any other position just behind or next to a group of people in a room or next to someone sitting in an armchair reading a book while listening.
The following pictures show again the frequency range. It is still the same speaker. This time, it is a good guess, that the reflections by the corner of the window caused the dip at in-between 250Hz and 300Hz. Have a closer look to the scale. This dip is about -14dB. Just as a reminder 6-10dB difference is about as double as loud as we subjectively hear. This dip is significant and as such a significant influence on the sound.
TestHiFi’s overall audio device examination result:Close to HiFi
Frequency response amplitude drops result:Close to HiFi
| 1: | 250-300Hz | -14dB |
| 2: | 13000-16000Hz | -5dB |
| 3: | 0-0Hz | 0dB |
| 4: | 0-0Hz | 0dB |
| 5: | 0-0Hz | 0dB |
| (see attached graph no.1) |
Frequency response amplitude peaks result:Possibly HiFi
| 1: | 1250-1400Hz | 5dB |
| 2: | 0-0Hz | 0dB |
| 3: | 0-0Hz | 0dB |
| 4: | 0-0Hz | 0dB |
| 5: | 0-0Hz | 0dB |
| (see attached graph no.2) |
Loudness at harmonic distortion limit result:Possibly HiFi
| 1: | 65-75Hz | 5% |
| 2: | 75-95Hz | 5% |
| 3: | 95-150Hz | 5% |
| 4: | 150-200Hz | 0% |
| 5: | 200-250Hz | 0% |
Intermodulation distortion – low freq. retult:Possibly HiFi
| test tones between: | 70 – 240Hz |
| Distortion level at: | -90% |
Intermodulation distortion – high freq. result:Possibly HiFi
| test tones between: | 620 – 13kHz |
| Distortion level at: | -75% |
Aurally-weighted intermodulation disconsonance result:Possibly HiFi
harmonic distortions K4 – K9 with higher levels identified compared to lower harmonic distortions (K2&K3)
| level K4+ above K2: | 0 times |
| level K4+ above K3: | 0 times |
| level K4+ above K2&3: | 0 times |
| max. level difference: | 10 % |
Stereo capability result:Close to HiFi
only one stereo channel or only one single box or two separated stereo channels found
| channels identified: | one |
| channel deletion: | no |
| stereo separation: | no |
Third positioning of the speaker
The third position shows the speaker on the couch table. Probably a rather rare situation when there are a group of people around, however more probable if just one sits there to relax and listen.
The following pictures show a much flatter frequency response.
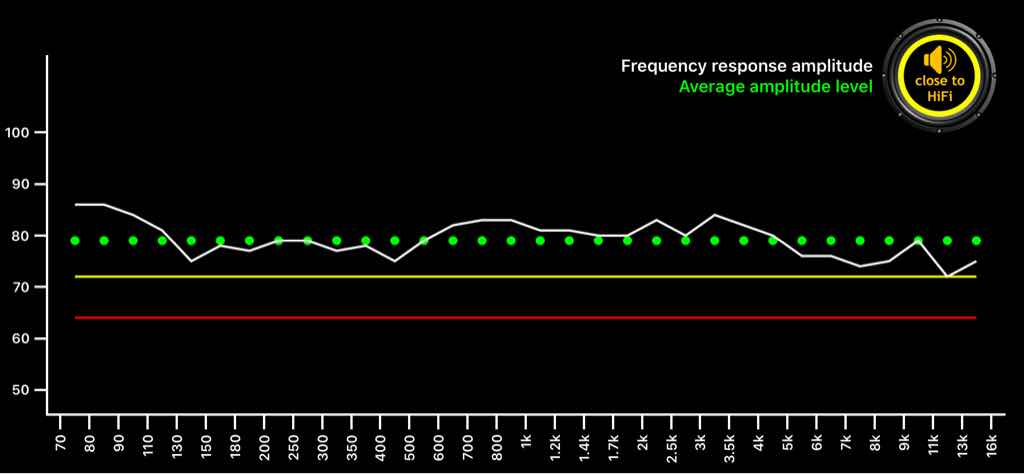
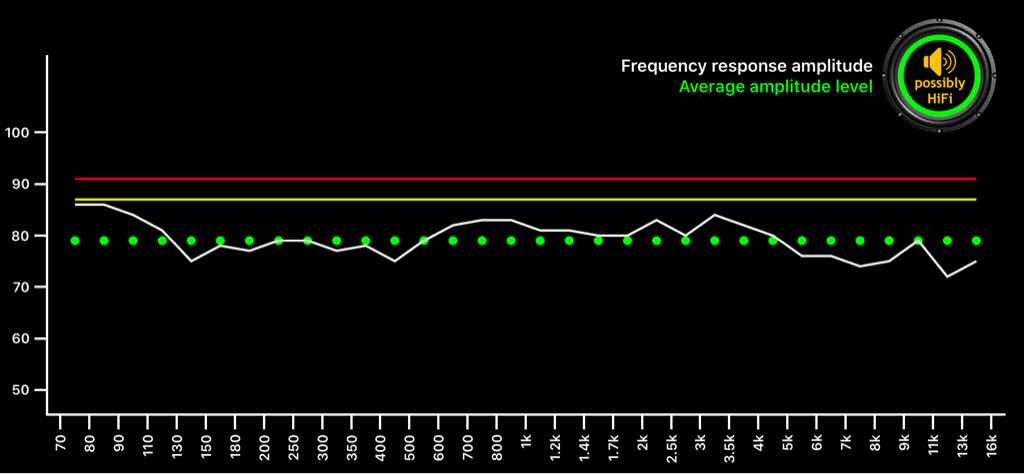
TestHiFi’s overall audio device examination result:Close to HiFi
Frequency response amplitude drops result:Close to HiFi
| 1: | 11000-13000Hz | -7dB |
| 2: | 7000-8000Hz | -5dB |
| 3: | 0-0Hz | 0dB |
| 4: | 0-0Hz | 0dB |
| 5: | 0-0Hz | 0dB |
| (see attached graph no.1) |
Frequency response amplitude peaks result:Possibly HiFi
| 1: | 3000-3500Hz | 4dB |
| 2: | 0-0Hz | 0dB |
| 3: | 0-0Hz | 0dB |
| 4: | 0-0Hz | 0dB |
| 5: | 0-0Hz | 0dB |
| (see attached graph no.2) |
Loudness at harmonic distortion limit result:Possibly HiFi
| 1: | 65-75Hz | 5% |
| 2: | 75-95Hz | 0% |
| 3: | 95-150Hz | 0% |
| 4: | 150-200Hz | 0% |
| 5: | 200-250Hz | 0% |
Intermodulation distortion – low freq. retult:Possibly HiFi
| test tones between: | 70 – 240Hz |
| Distortion level at: | -90% |
Intermodulation distortion – high freq. result:Possibly HiFi
| test tones between: | 620 – 13kHz |
| Distortion level at: | -85% |
Aurally-weighted intermodulation disconsonance result:Possibly HiFi
harmonic distortions K4 – K9 with higher levels identified compared to lower harmonic distortions (K2&K3)
| level K4+ above K2: | 1 times |
| level K4+ above K3: | 0 times |
| level K4+ above K2&3: | 0 times |
| max. level difference: | 155 % |
Stereo capability result:Close to HiFi
only one stereo channel or only one single box or two separated stereo channels found
| channels identified: | one |
| channel deletion: | no |
| stereo separation: | no |
Effects of mobile speaker’s positions
The last position might still not be without room acoustic effects, however shows a much flatter frequency response than the other two. The size of the dips and declines in the first two positions are of much more significance than the variances in the last position.
Measurements make things objective. Although we can hear the differences and we know about them, we sometimes tend to ignore them. Not a must, but sometime a good wake-up.