
Frequency response left versus right, sum and stereo
Frequency response
This is quiet an established measure, of course. However, even frequency response is not fully accepted. We wrote several blogs related to flat response or peaks and drops in frequency response and we received lots of feedback. Some of which was very positive, some was friendly and constructive and still there was some feedback pretty emotionally arguing 🙂 , even on such basic measurements.
As explained in the blog “why is flat frequency response so important” it is quite important, that the input into an audio system is equal to the output of an audio system except the amplification, i.e. it is louder. But the system should not deliver specific ranges of frequencies louder than others. The system should neither deliver some frequencies with far less amplitude, as tones in those areas would just be missing.
All variations to the dB values across the frequency range, typically between 20Hz and 20kHz, caused by the audio system are manipulations to the music as it was intended by the artist. Equalizers can manipulate the frequency response either to cover for weaknesses, like peaks or drops or to address personal preferences, like bass boosting.
How to know about your frequency response
Having said this, how do we know the frequency response of our audio system. If there are specs available, usually you would read information as specific as: Frq.: 20-20kHz. Basically this explains the principle ability of the system to deliver frequencies from as low as 20Hz up to 20kHz. However it does not say anything about the amplitudes of those frequencies. It is very common, that lowest and highest frequencies are delivered with -6dB, -10dB or less. Keeping in mind that -10dB is perceived as less than half as loud, it clearly has a significant impact on the sound.
For some systems there are diagrams provided. Not even talking about the several components a system might consist of, each potentially having a diagram available. However, how much of any help is it to know the systems frequency response, knowing well, that biggest impact to the received frequency response at listening position, is the room influence, the reflections. Even though the audio system might deliver a quiet flat response, or EQ adjusted to personal preferences, the floor in front or the walls and the sealing might take lots of the received frequencies amplitudes away. For more explanations see the blog “why could a bad speaker be measured good at listening position” and the blog “listening position measurements”
Frequency response at our listening position
What can we do to understand the frequency response at our listening position, i.e. including the room influence, the frequency response we finally hear. Well, as most “audiophiles”, we use a kind of real time analyses to briefly check the frequency response at our listening position. The RTA presents us a real time view of all the frequencies in a real time diagram. That is interesting and cool. However it does not easily provide the information we are looking for. Looking at a RTA tells us a lot about the signal. In case the signal is music, we see the frequencies of the music visualized. That does hardly allow to judge the flatness of the frequency response at the listening position.
Better than music could be a pink or white noise. That would deliver a more stable diagram and would allow for a better judgement, but still not very easy for the untrained user. It starts already with the differences between the two. Noise has to do with energy and white noise is equal energy for each frequency. All frequencies across the human audible spectrum are represented by equal amounts of energy. Pink noise is all about octaves and pink noise has equal energy per octave. Octave bands are how we hear music and sounds.
Some might have an appropriate measurement tool setup to proper measure the frequency response at listening position. This is quite important to design the listening room and to adopt the room to optimize the sound at listening position with room acoustic treatments.
Why not measuring frequency response twice or more
Let’s assume we have a proper measuring tool set up and we could measure the frequency response at listening position including the room influences. Such a diagram would tell us what we would receive, i.e. what we would be able to hear at our listening position, if the input into the audio system would be an equal amplitude across the frequency range. Reflections by the room or weaknesses by the audio system or both would be visualized in such a diagram.
The other day I read a sticker on the back of a car: “don’t let your bass drop”. In case floor reflections or back wall reflections would cause bass drops, we would see it on the diagram.
What would we see, if we would measure the frequency response per stereo channel. In theory the diagram should display the same for the left and the right channel, for the same input signal. However, as I always say: “The difference between theory and practice is bigger in practice than in theory” Although the audio system most probably delivers the same output on both channels, the room influences are usually quite different to the channels. As such, what we receive at our listening position is also quite different between the channels.
Once left, once right and once stereo
If we measure three times, once left, once right and once stereo, we could see how left and right channel might sum up to the stereo signal. All three curves in one diagram would allow us for easy identification of variation between the three curves. A fourth curve would make it even more interesting, the sum of the signals of both channels.
The sum of both channels is close to measured stereo, if of both channels are received with the same phase. Signals might be received with different phases, because of earlier or later reflections. As a result, comb filters might occur. The sum of the amplitudes of the two signals might be much higher than the stereo measured signal. As the stereo measured signal includes the deletion of the signals due to th comp filter effects. The stereo sound is the real sound we actually get to hear.
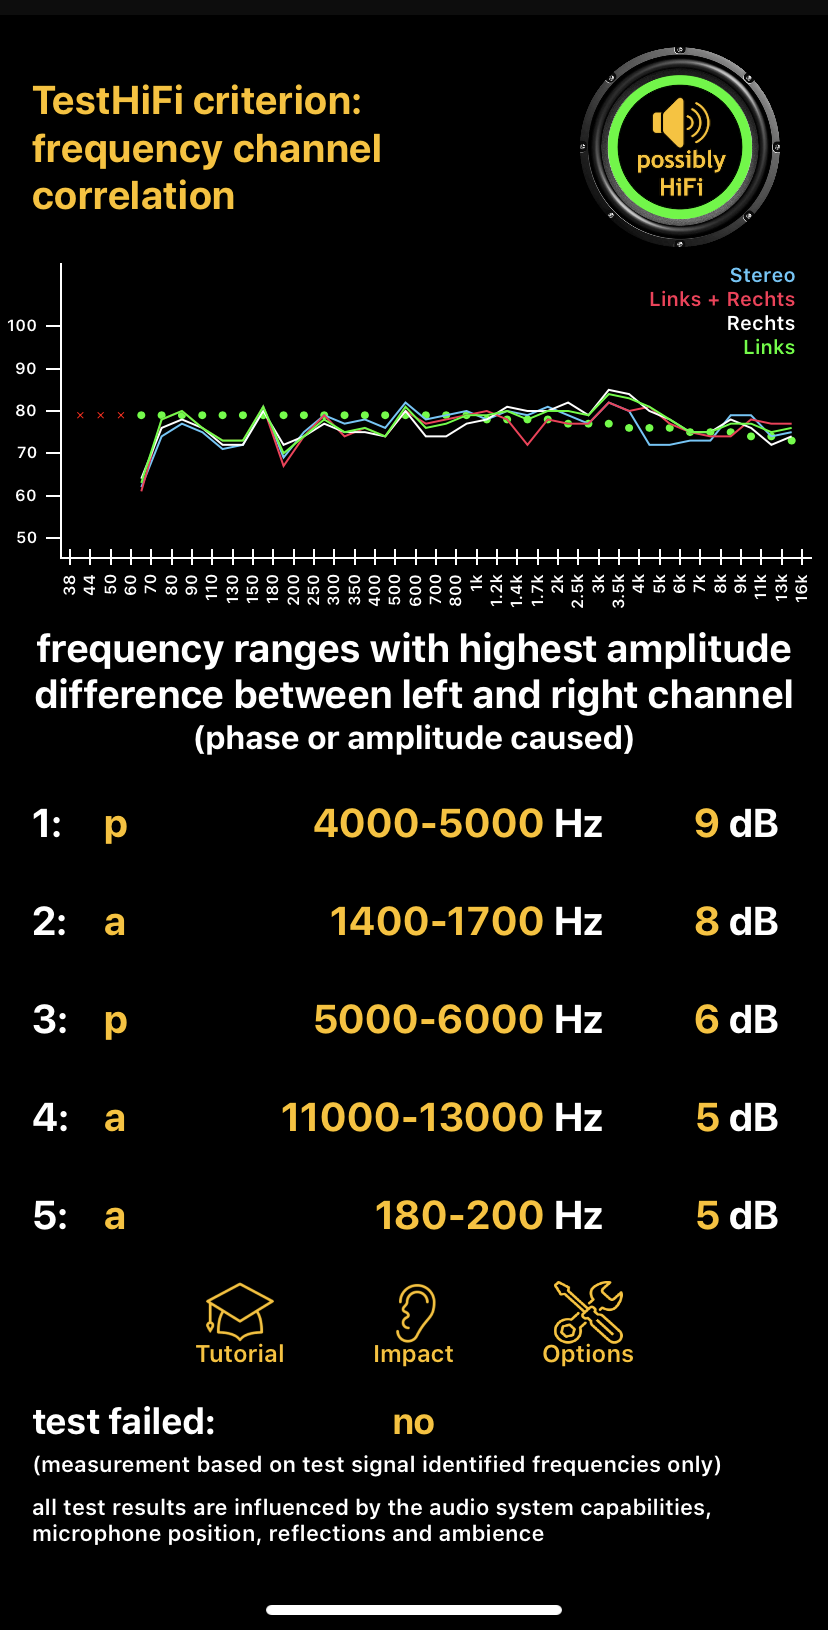
(Source: TestHiFi App new measurment at listening position, currently under development)
Why is all that important
It is about the degree of manipulation to the sound we finally hear. Manipulation by the whole system and by the environment we are listening in.
A none flat frequency response manipulates the original intend of the artis before it reaches our ears and we hear it. With equalizers and of course by acoustical room treatment one can correct this to some degree. With the prerequisite, we know what to fix. To know what to fix, some measure the frequency response, others try to identify it just by listening.
With respect to impact on the listening experience
On one blog we received a very nice feedback, which I would like to cite here. Thank you Robin for your feedback. We appreciate all friendly feedback being positive or constructive. And we will try to contribute to the words for explaining good sound 🙂
“As we do not even have words for the possible differences, maybe we need to start with some definitions? The differences (in no particular order) that I hear in my words are:
1) Articulation (the shape of the beginning of notes) This is not just “attack”
2) Space (the size of the instrument and relation of that size to other instruments/voices in the recording – being able to create a large massed string section out of many individual “smaller” single voices
3) Decay (bad description) How the notes taper off – the natural taper of the instrument PLUS how it tapers in space – trumpet decay is differently shaped than a voice or a piano
4) Sense of pitch. Even although we can measure 440Hz and its overtones for a concert “A”, very often it sounds higher or lower pitched than it really is. This screws up the resultant (sum and difference tones) pitches due to acoustic intermodulation. Sections of a recording sound “out of tune”.”